How KULG can help you train smarter and run better
Running is not just about lacing up your shoes and hitting the road. It's about progress, endurance, and achieving personal goals. But how do you know if you're improving? How do you measure whether your training is working or if your body is adapting well to the workouts? This is where running analytics tools come in.
In this article, we'll break down how the running analytics of KULG can take your training to the next level.
What is running analytics?
Running analytics involves collecting and interpreting data from your running sessions. This data can include your distance, pace, heart rate, duration, and other key metrics.
The purpose of running analytics is to provide actionable insights into your performance, helping you adjust and optimise your training to achieve your running goals.
Common examples of running analytics tools are for example, Strava, Garmin, or Nike Run Club.
For runners looking for deep insights, KULG provides a complete picture of progress towards goals. We make it easy to see the connections between different types of health and training data, so you can learn how to train smarter while staying healthy and motivated.
What's the value of a training log?
By keeping a training log and systematically tracking your data, you can gain insight into your running habits, strengths and areas for improvement.
Keeping a training log is important for several reasons:
Your feeling: One of the most important things to keep track of is how you feel and how hard the effort seems to you. In KULG, you can visualise this on a graph, alongside with all the other running data that can be measured, not felt.
Progress measurement: Without data, it's hard to tell if you're improving. But tracking metrics like pace, distance, and heart rate allows you to see how you're progressing over time.
Injury prevention: Overtraining or undertraining can both be harmful. Monitoring data such as heart rate variability (HRV), sleep patterns and recovery metrics can help to prevent injury. By understanding how your body responds to different training loads, you can adjust your training schedule to avoid overtraining and to ensure that you recover properly.
Goal setting: Data helps set realistic, achievable goals and create a personalised training plan. Whether you're training for a 5K, marathon, or just want to get fitter, by analysing your past performance data, you can identify trends and patterns to help you manage your training.
Accountability: When you track your runs, you’re more likely to stay consistent and motivated.
Transform your running performance with KULG
At KULG, we love data, and we believe in the power of using that data to transform your running experience. Whether you're a beginner or an intermediate runner, understanding and using your running data can be a game-changer.
We integrate multiple data points and compare your training data with your subjective feedback. Visualising your long-term running trends gives you personalised insights and a big-picture of your performance. You can easily monitor your progress, compare your runs and spot trends and areas for improvement, and adjust your training.
How it works
The KULG app is designed to give you all the insights you need to make smarter training decisions.
Here's what you can do with it:
Track your feeling and perceived effort: We put what you can feel and what you can measure side by side on the graphs. This gives you a better picture of how your mood and recovery affect your training and vice versa.
Track various activities: Monitor everything from different types of running to other sports that you may do for cross-training or recovery, all in one place.
View graphical insights: Visualise your activities through graphs to make it easier to interpret your training data.
Get summaries: Break down your data by week or month to identify long-term trends.
Analyse detailed metrics: Track running metrics like heart rate, pace, and effort, and how they change over time.
Track your sleep: Connect your sleep data to your running performance and gain insights into how rest impacts your workouts.
How the graphs in KULG help you train better
One of the highlights of the KULG app is the wide range of graphs that provide a detailed insight into your training.
Here’s a breakdown of each graph and how it can help you as a runner:
Distance
This graph shows your total running distance compared to the number of runs. One easy way to stay on track with your goals is to follow weekly and monthly distance.
Pace
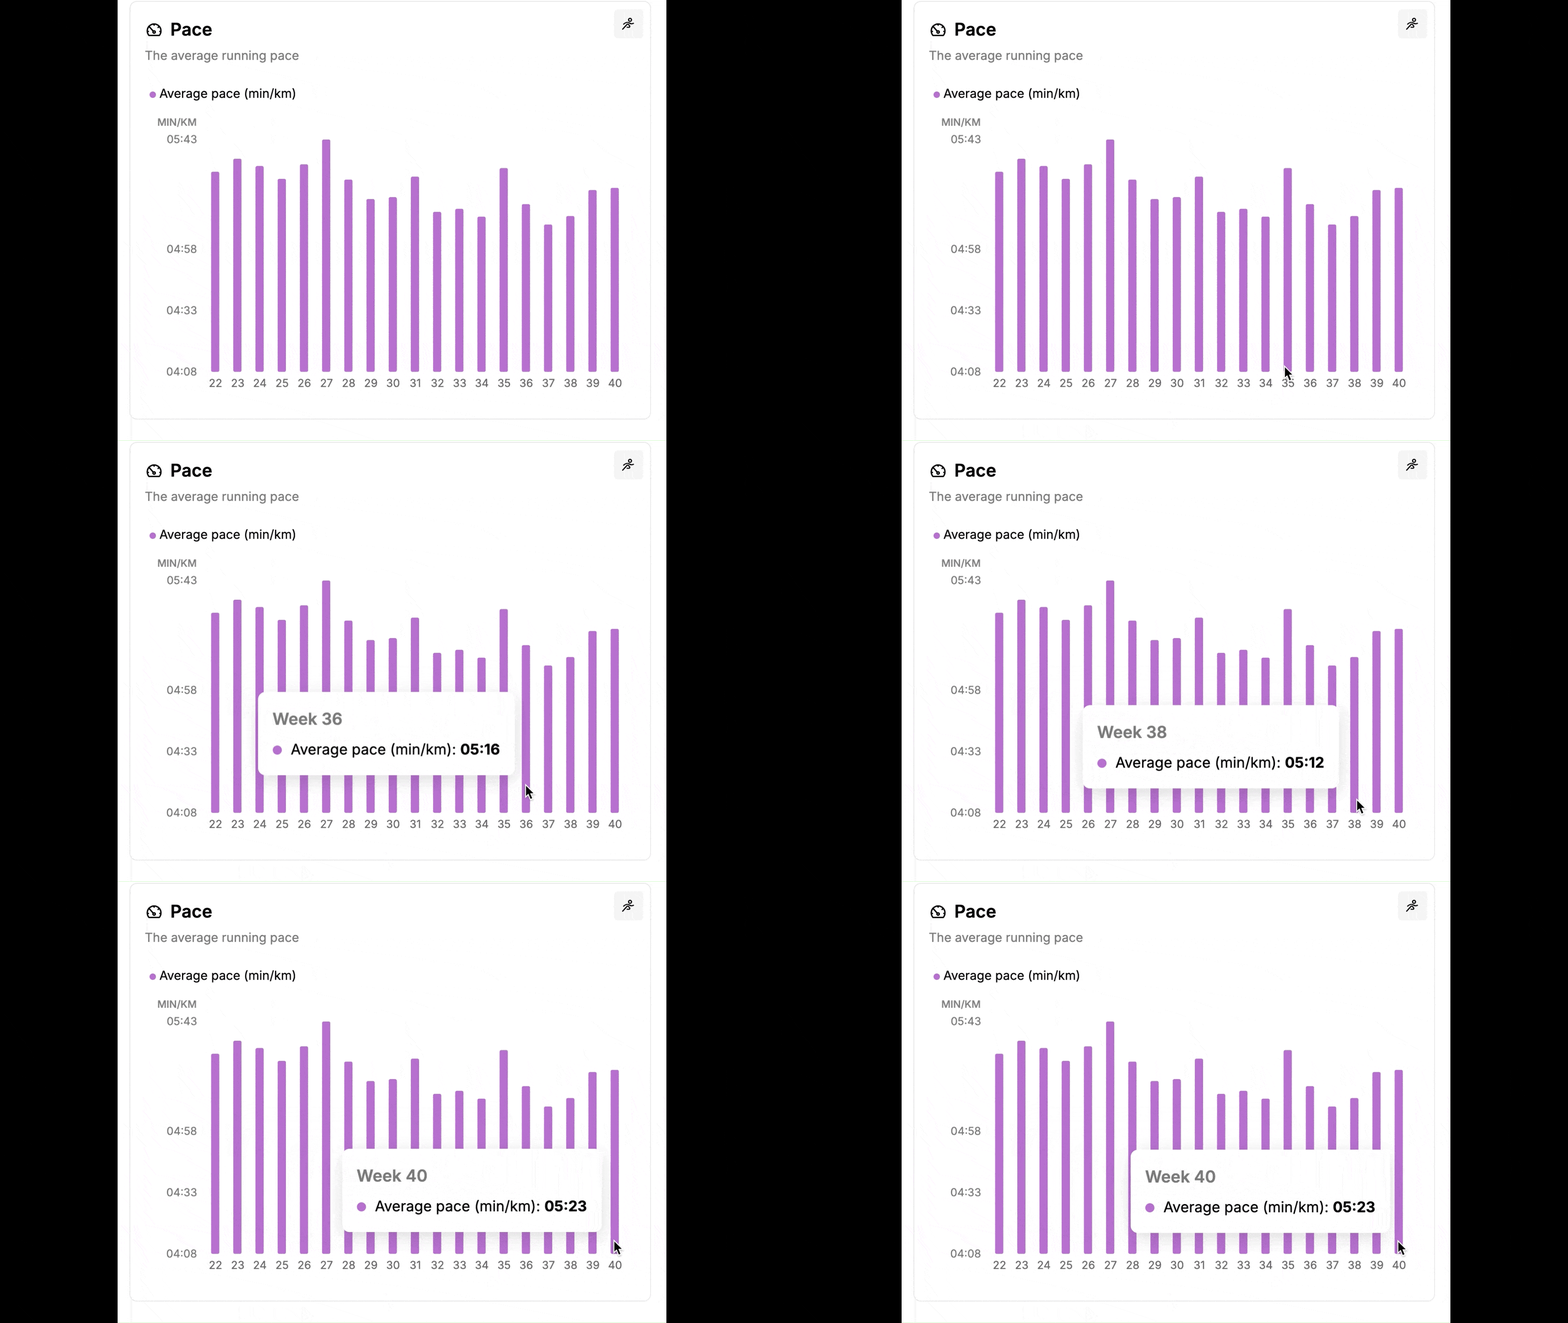
The pace graph tracks your average running pace on each run and your elevation gain.
Monitoring your pace is key to understanding your performance in different conditions.
Look at it in the context of your heart rate or perceived effort (RPE). If you're running faster and both your RPE and HR are higher, this may not necessarily show that you're improving but just that you're running harder.
But if you run faster and your HR remains the same as when you ran slower, this is an indicator that your fitness level is improving. In KULG app this is indicated on the HR vs speed graph.
Heart rate
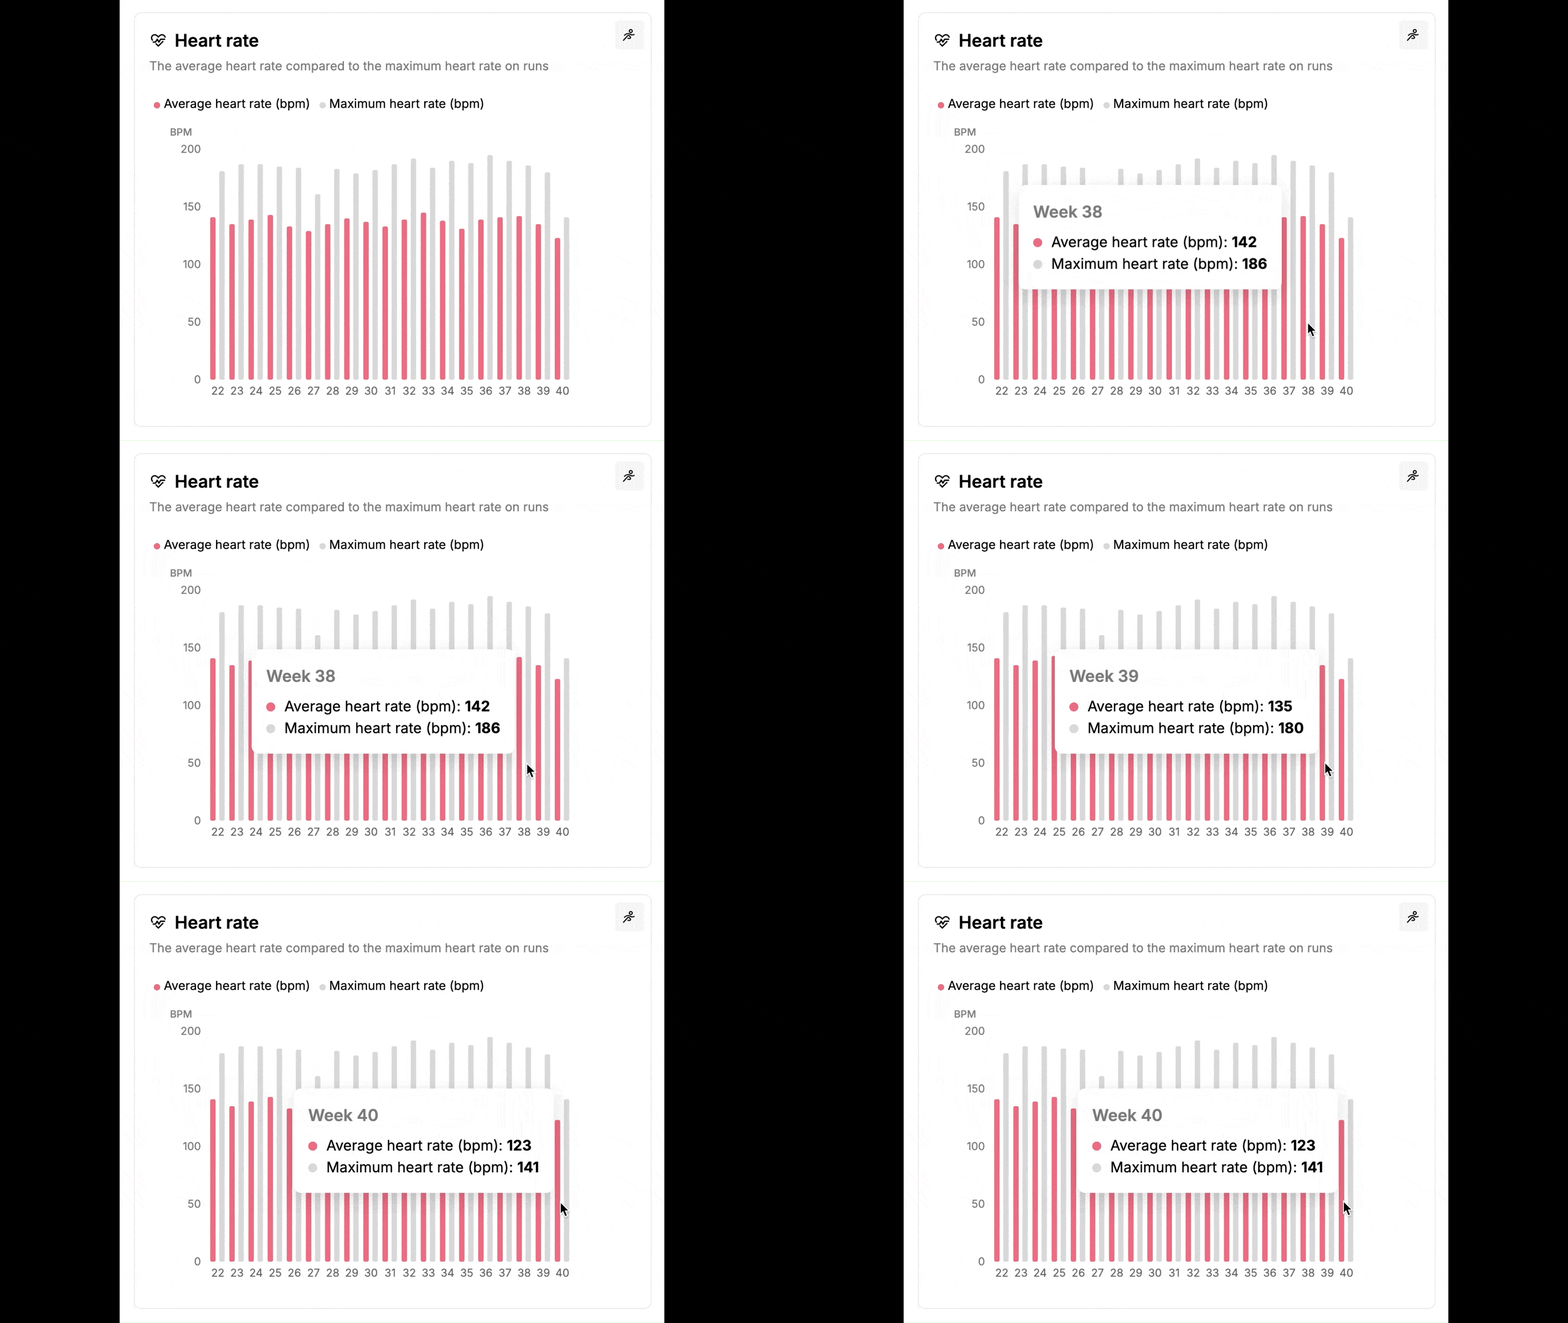
This graph shows the average heart rate compared to the maximum heart rate on your runs.
Your heart rate is an important metric that provides a better understanding of your cardiovascular fitness and training intensity. Maximum heart rate helps to determine your heart rate zones.
—
What is heart rate?
It's the number of times your heart beats per minute. Your maximum heart rate is the highest rate your heart can achieve during physical exercise, while your resting heart rate is the number of beats per minute while you are at rest. Tracking these can help you measure how well you're adapting to your training.
HR vs speed
This graph shows how your heart rate compares to your running pace over time.
This is a useful way of monitoring how efficiently your body is working.
It's useful to look at the overall trend line rather than specific numbers. If the trend line is going up, you are running faster at the same heart rate, indicating that your aerobic fitness is improving.
Be aware that seasonality can affect this. In winter, with heat or at altitude the trend line may go down. And for a race, you'd want the trend line to go up.
Duration
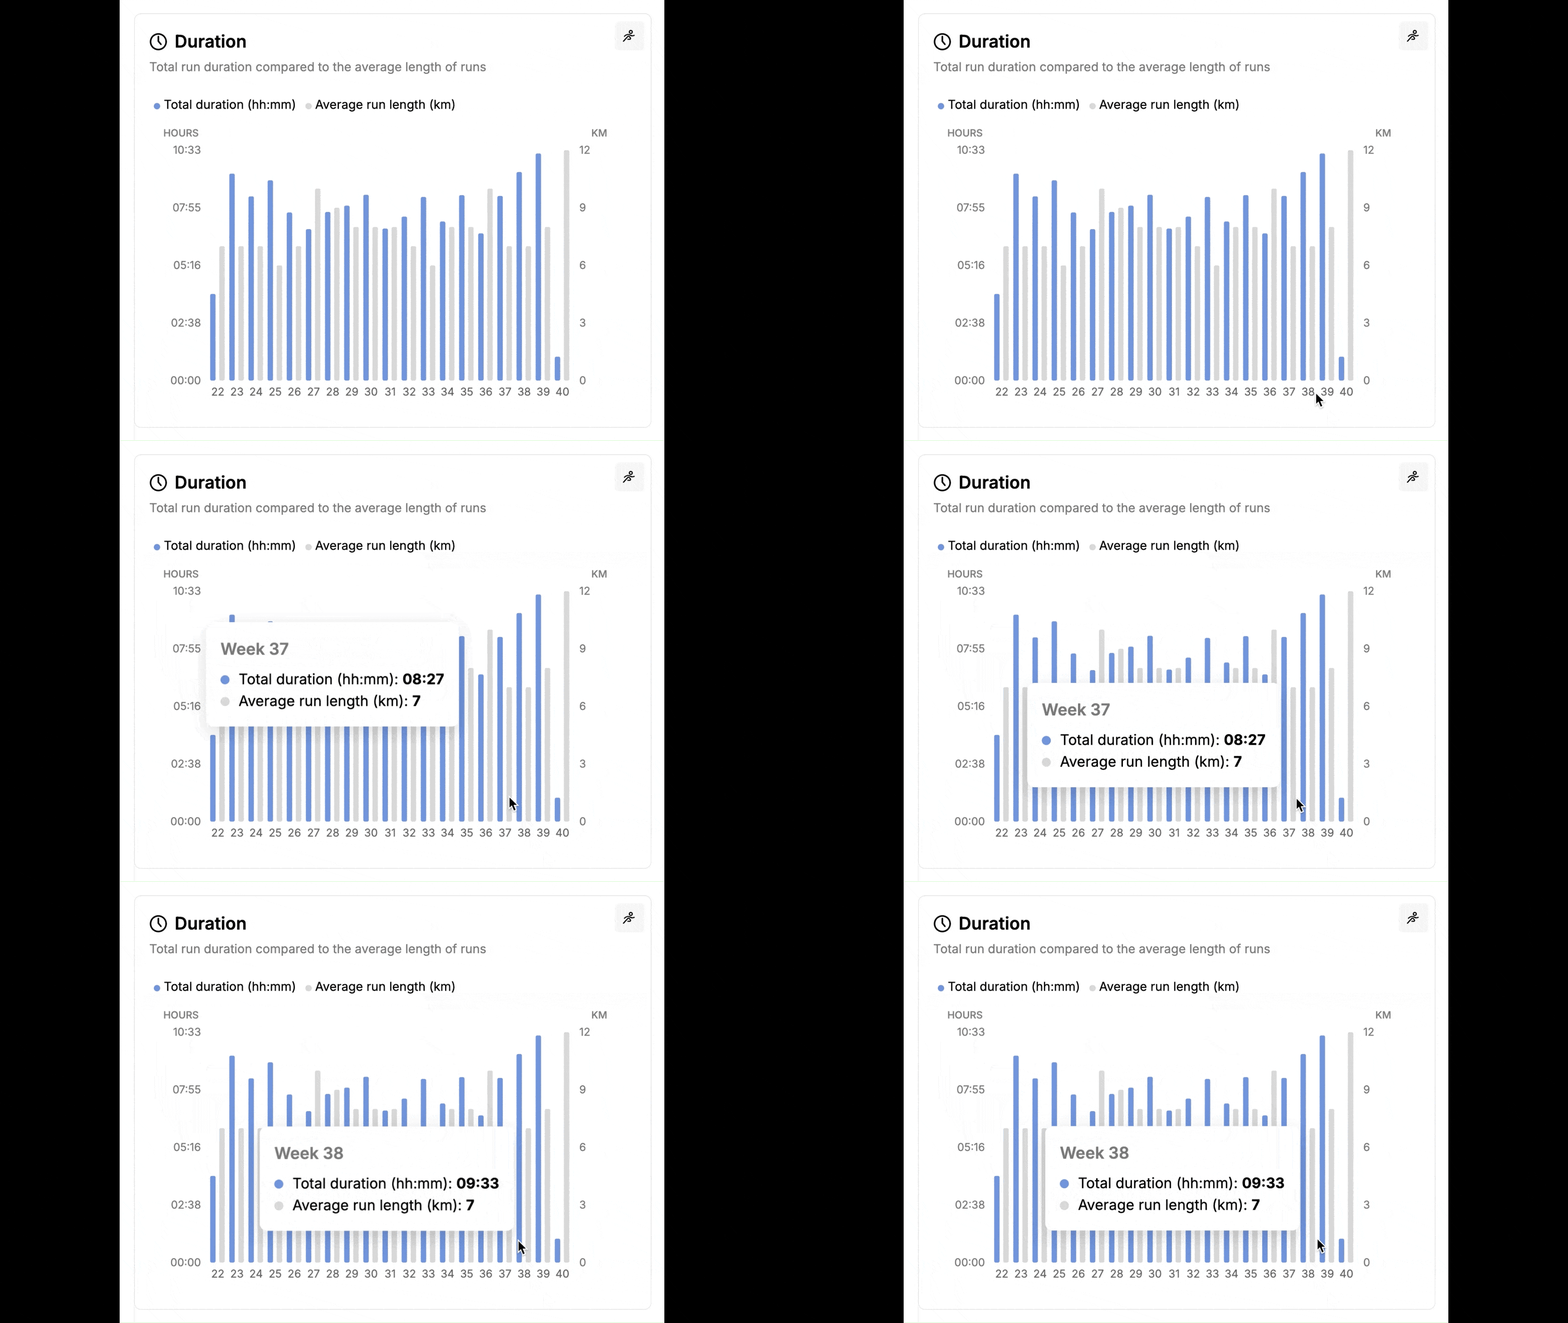
This graph compares the total run duration to the average length of your runs.
By looking at this, you can ensure that you're gradually increasing your run times, especially when preparing for longer distances or improving endurance.
Intensity
This graph shows the amount of high-intensity run kilometers compared to your total distance. KULG app let’s you track high intensity kilometers on different types of runs, so you can also count short repeats into the volume of high intensity running.
Balancing high-intensity runs with easier sessions is crucial to avoid burnout and injury while improving performance.
Feeling and perceived effort
This graph tracks how you feel during and after your runs alongside your perceived rate of exertion (RPE).
RPE is a subjective measure of how hard you feel your body is working during exercise, but it's helpful to see the big picture. It allows you to learn to listen to your body and intuitively understand the HR and how hard the body is working.
How hard the workouts feel is useful to compare with your measured performance data, such as your pace.
If you run faster in training but have a higher RPE, you may not be at a better level. You may just be working harder in training.
On the other hand, if you are running slower and your RPE is also significantly lower than your previous runs, then you may be improving, especially if your HR data supports this.
Over time, this data can help you adjust your training based on how your body is responding.
Feeling: How you feel when you train can be an indicator of overtraining if the trend is going down. External stressors only add to the stress of training and make recovery more difficult. Looking at the trends allows you to see how you are doing and where you need to focus your recovery.
Sleep quality
Sleep is crucial for your recovery. Poor sleep can affect your performance and recovery.
We offer you to track your sleep quality on a scale of 1 to 5 because we believe that your internal view of your sleep is better than any score from a sleep measuring device. Sometimes we sleep fewer hours but feel more rested, sometimes the devices give us a good score but we feel less fresh.
By monitoring your sleep data on training days, you can better manage your overall training load and understand how it impacts your results.
Why KULG will help you train smarter and run better
KULG app integrates multiple data points and compares your training data with your subjective feedback. Visualising your long-term running trends gives you personalised insights into your performance to help you run better. You can easily monitor your progress and adjust your training.
By providing detailed graphs and insights, it empowers you to:
Understand your progress over time.
Make data-driven decisions about your training plan.
Identify areas for improvement, like pacing, intensity, and recovery.
Stay motivated as you see the direct results of your work.
KULG helps you train smarter, not harder. By analysing key metrics such as heart rate, pace, distance, and intensity, you can optimise your efforts for better results while reducing the risk of injury. It also helps you balance your training with proper recovery and ensures you're not overdoing it.
Join us to understand your training progress with ease and train smarter or check out what we offer.
Katharina is a passionate runner who has been running since her teenage years and is also a certified running coach. She loves empowering others to achieve their goals, find joy in activity, and to become better and more balanced runners. You can find her on Instagram @madkaddi.


